Price range
How Restaurantology calculates and standardizes price ranges across Concepts and Companies.
Updated over a week ago
Restaurantology’s price ranges provide an at-a-glance indicator of average customer spending at a restaurant. This helps sales, marketing, and RevOps teams better align solutions based on consumer spending patterns.
Price range tiers
Restaurantology standardizes price ranges into four categories:
- 1-10 USD ($)
- 11-30 USD ($$)
- 31-60 USD ($$$)
- 61+ USD ($$$$)
How price ranges are calculated and rolled up
- Price range signals are gathered at the unit level from a variety of publicly available sources, including restaurant websites, review platforms, and social feedback sites.
- Data is normalized to account for outliers and discrepancies.
- Unit-level price ranges are aggregated to the Concept and Company level.
- The most common price range is assigned to the profile and displayed in Restaurantology products and exports.
[!INFO]
Price range aggregation prioritizes data consistency, but certain Concepts or Companies with broad pricing models (e.g., casual dining chains with both premium and value menu items) may reflect the dominant price tier across most locations.
Considerations and limitations
Price range data includes an inherent degree of subjectivity due to variations in data sources and regional pricing. Publicly available data, especially from user-generated sites, can be influenced by:
- Sentiment bias (customers may overstate or understate prices based on experience).
- Outdated information (prices may change without updates to public listings).
- Data scarcity (smaller or long-tail Concepts may lack sufficient data for precise calculations).
[!NOTE]
Restaurantology applies normalization techniques to reduce bias but encourages users to view price ranges as directional indicators rather than absolute figures.
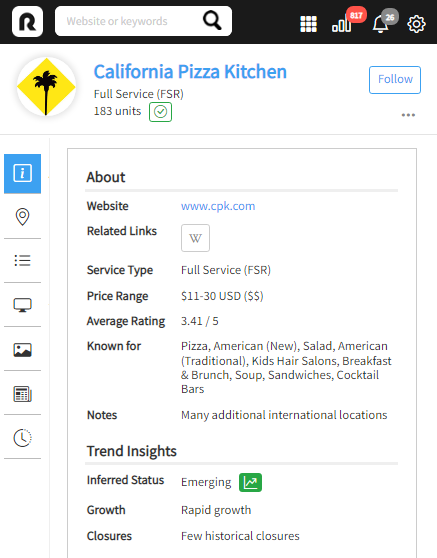
Example profile
A Restaurantology profile complete with price range:
Next, continue to Concepts and Companies →