Historical closures
How Restaurantology verifies and calculates unit closures over time.
Updated over a week ago
Historical Closures reflect the number of units a Concept has permanently closed within the past 24 months. This metric provides valuable insight into brand stability, market positioning, and potential risk factors.
Calculation methodology
Closures are calculated as a percentage using the following formula:
(Count of units closed) / (Count of units closed + Count of units open)
- Units closed: Verified, publicly discoverable closures within the past 24 months.
- Units open: Verified physical locations as of the latest monthly scan.
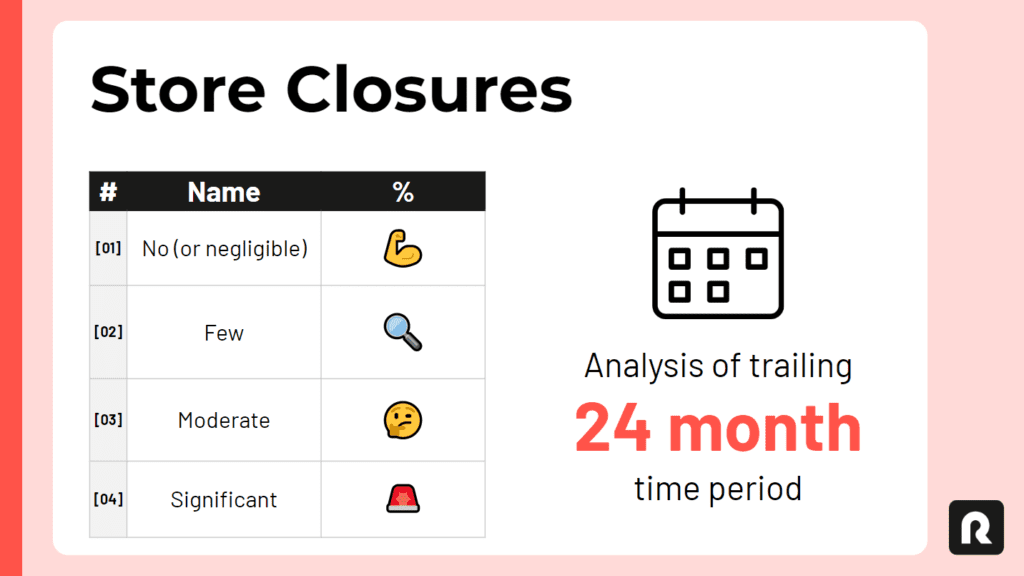
The resulting percentage assigns a closure severity tier:
- No (or negligible)
- Few
- Moderate
- Significant
Market segment scaling
Thresholds between closure tiers are scaled by market segment. Larger brands can experience a higher number of closures without necessarily being categorized at the highest severity.
Interpretation considerations
[01] Subjectivity of closures data
Closure data depends on publicly available information, which may lag behind actual closures. Smaller brands often delay removing closed units from public listings.
[02] Frame of reference
A Concept may accumulate closures even while expanding overall. Reviewing closures without considering Unit Growth can lead to an inaccurate assessment of brand health or trajectory.
[!TIP]
To account for both openings and closures, Restaurantology recommends using Inferred Status, which blends recent growth and closures into a single growth trend metric.
Additional information
While this article explains the methodology behind Historical Closures, instructions for applying closures filters can be found in Browse using an advanced search.
Next, continue to Unit trend insights via Inferred Status →