Is restaurant unit growth the best measurement of success?

It’s been a rough few years for restaurants, but growth and expansion are back on the menu.
When restaurants talk about growth, they mean a couple of things: expansion into new markets or new unit growth into existing territories. They could also talk about growth in terms of overall profitability or unit economics.
At Restaurantology, we’ve been busy looking at how restaurants define growth with the singular goal of helping sales and marketing teams understand the life-cycle “status” of a multi-unit restaurant brand, concept, or company at any given moment.
Knowing a brand’s “status” in the account-based sales world helps go-to-market (GTM) and revenue leaders size their market accurately and confidently. It helps sales, SDRs, and AEs know their territory and prioritize prospecting. And it allows marketing to create compelling and personalized messages for accounts or groups of accounts.
This blog is the first in a three-part series where we will define restaurant growth. In the next blog, we will look at restaurant contraction. And finally, we’ll combine growth and contraction to generate a holistic view of a multi-unit restaurant’s status and its growth trends over time.
A quick restaurant TAM recap
Before we dive into defining restaurant growth, there are a few things worth mentioning. When you sell into the restaurant industry, you find a few things out pretty quickly:
- The restaurant industry is both very large and very small,
- Segmentation is nuanced,
- Multi-unit restaurant location data is difficult to find and keep up to date,
- And your Ideal Customer Profile (ICP) is the same as other companies competing for time and attention to pitch their product or service.
You can’t build a solid GTM strategy or sales plan without considering these essential facts. And, when you do, you’ll likely come to a few new conclusions depending on your sales organization’s size, structure, and maturity level.
What we’ve seen over and over in our years of selling into the restaurant space is that no matter how you slice and dice your strategy, most companies realize they need a plan and approach to selling into multi-unit restaurant brands.
To do that, you need to understand the landscape of multi-unit restaurant brands, concepts, and companies. But there are challenges.
Challenges with traditional restaurant location lists
The very dynamics of the restaurant industry are to blame for the issues with traditional restaurant location lists. Locations are open and closed within months. Decision makers jump ship to another concept. Large, franchised brands commit publicly to broad expansion plans – only to come up short after a quarter of lower-than-predicted performance.
All of that has led to restaurant location data that is:
- Static: There are two things usually going on here. One, the available restaurant location data is updated just once a year. Two, the data only shows you a snapshot of what units are open and what units are closed, which leads us to our second challenge.
- Not organized: Locations are not attached to a parent company, and rarely is there an indication that they are part of a concept with multiple units. A lack of organization leads us to the final issue with the data.
- Limited in context: A snapshot in time only gives you a portion of the story. What you’re looking for are trends over time — in this case, who’s growing and how quickly.
Now that we’ve gotten that out of the way, let’s talk about how Restaurantology measures multi-unit restaurant growth.
Measuring multi-unit restaurant growth
Multi-unit restaurant growth in Restaurantology is broadly expressed in terms of positive growth or negative growth. To measure whether a brand has positive or negative growth, we look at unit count data over time. We track the current month’s verified unit count and compare it to the data captured six months in the past. We’ve learned that six months is the right amount of time to allow change to occur and offers the best restaurant market intelligence on multi-unit brands.
What do we mean when we say verified? It’s a good and important question to answer. Our version of unit growth is based on what restaurant brands communicate to the world via their public website(s). Restaurantology looks across 15,000+ websites to verify the data and provide qualified restaurant market intelligence to our partners. (We dig into self-qualified vendors[1] who sell[2] moment-in-time data[3] via lists[4] in this blog and why they aren’t good enough when selling to restaurants today).
With that verified information on unit count neatly organized by parent company, concept, and individual units – we can now activate that data and use it to quickly and at scale understand growth at any given time for one or many different restaurant brands.
Positive, Negative, Rapid, and Stagnant Growth
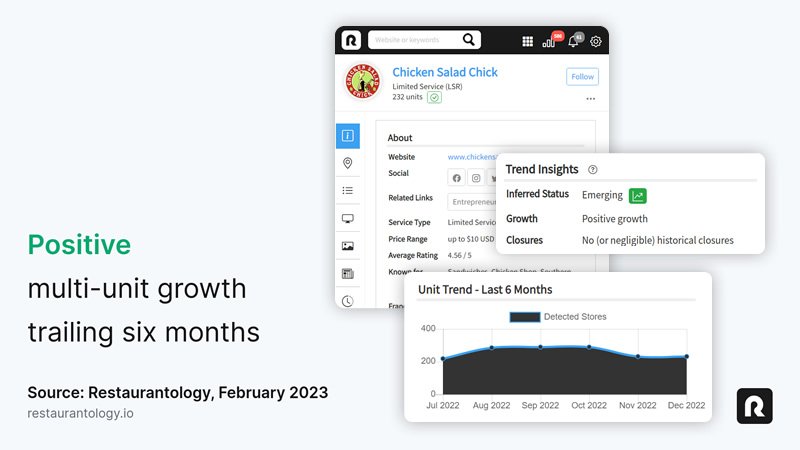
Positive Restaurant Growth
When is it Recorded: Positive Unit Growth is recorded when a restaurant brand, concept, or company is currently projecting new unit growth with a minimum of one (1) new location.
How the Data is Calculated: Restaurantology looks at publicly available projected unit count data over the previous six months and compares it to the current number of locations advertised on their website. It is a leading indicator that a multi-unit restaurant brand anticipates increasing locations over a particular period.
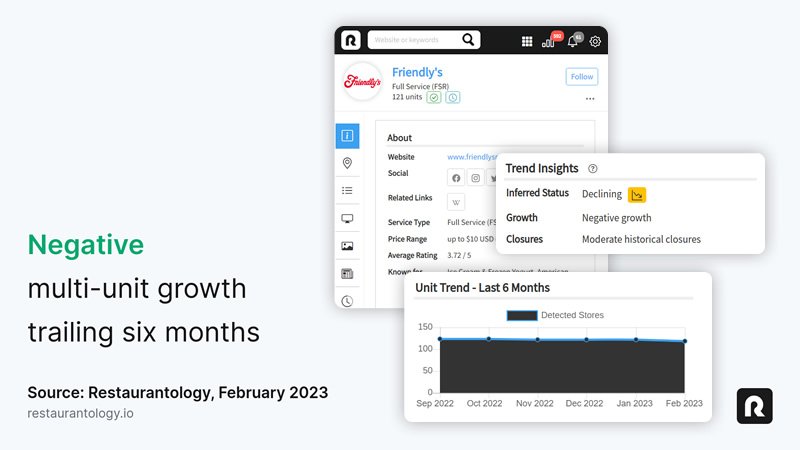
Negative Restaurant Growth
When is it Recorded: Negative Unit Growth is recorded when a restaurant brand, concept, or company is closing stores whereby the current number is lesser than the number advertised 6 months ago by at least one (1) location.
How the Data is Calculated: Restaurantology looks primarily at the number of closures. While it takes into consideration any publicly announced net new locations or actual new locations opened, a restaurant brand experiencing negative growth is not opening any new locations or has not made plans public. It is a leading indicator that a multi-unit restaurant brand is experiencing, or likely to experience, a contraction.
Now that you understand Positive and Negative Growth let’s look at two more categories of restaurant growth: Rapid Growth and No Growth.
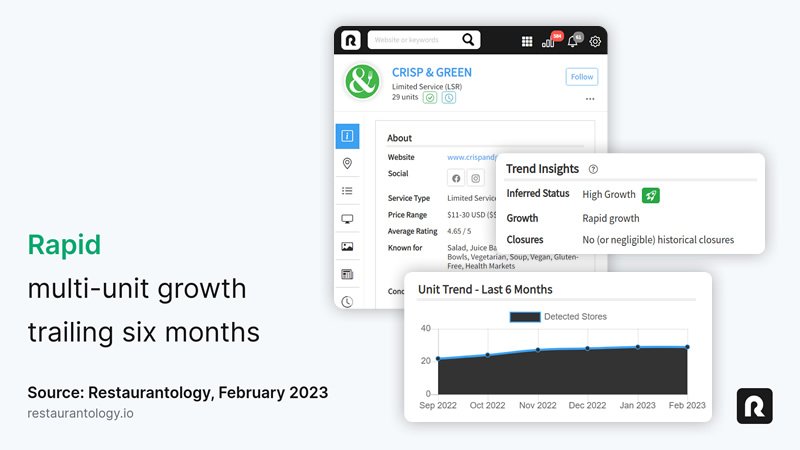
Rapid Restaurant Growth
When is it Recorded: Rapid Unit Growth takes into consideration a few additional factors. It is recorded when a brand is opening units rapidly compared to the company’s historical data and, most importantly, within the brand’s segment. In this case, we consider a segment a size – Small Business (SMB), Mid-Market (MM), or Enterprise (ENT).
How the Data is Calculated: Rapid Unit Growth is calculated as a sliding-scale percentage (as a % of total TAM) within that brand’s particular segment. The goal is to isolate the top 1 percent of brands in each segment with the fastest, most rapid advertised growth.
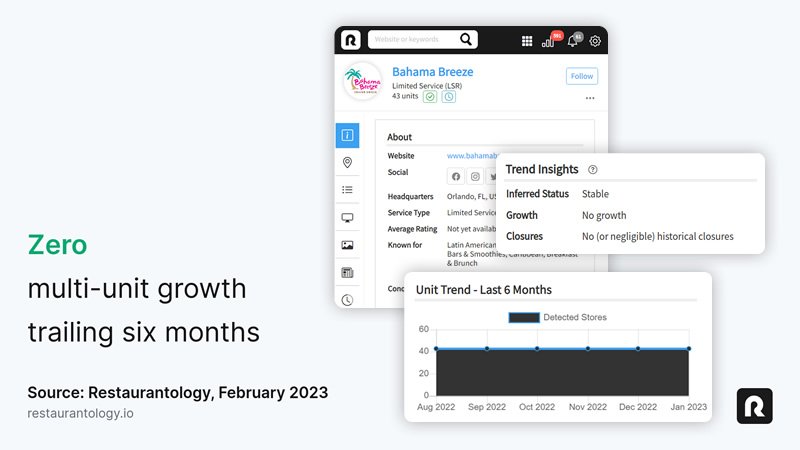
No Growth
When is it Recorded: No Growth is recorded when a restaurant brand, concept, or company has not announced any new unit growth projections or opened new locations.
How the Data is Calculated: No Growth results when comparing the current number of locations advertised on a website with that of 6 months ago, where the numbers are the same and therefore have a variance of 0.
When to exercise caution
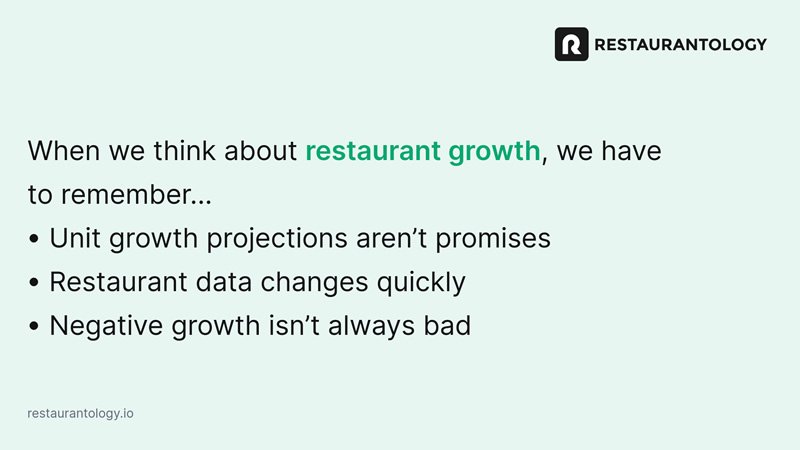
Restaurant unit growth projections are not promises. Restaurants announce expansion plans and new unit growth projections every year. And, every year, multi-unit restaurant brands fall short of their goals. Unit growth data is a solid leading indicator. It can and should help you prioritize accounts across territories. But it’s important to refresh the data regularly so that your pipeline and prospecting plans are accurately forecasted.
Restaurant data changes quickly. Restaurantology frequently crawls 15k+ industry-specific, known-to-be-multi-unit websites to gather publicly available location and tech stack data that we analyze and map to familiar, consistent profiles. But the data does change and can tell a different story about a company’s growth trends from one quarter to the next. It’s important to monitor accounts and growth trend data over time.
Negative growth isn’t always bad. In the restaurant industry, negative growth does not necessarily indicate poor performance. Unit-level economics could be soaring for the majority of open locations – but a few markets may be shuttering stores for any number of reasons. If you see “Negative Growth” after researching a restaurant brand in Restaurantology, further investigation and outreach are reasonable next steps.
Coming up next: Restaurant Growth and Contraction Continued.