Mapping the POS landscape: From web detection to phone confirmation

If you needed the clearest view of POS adoption across U.S. restaurants, where would you start?
Most teams begin with what’s visible: a POS vendor’s website, a glossy market report, or an investor deck touting “install counts.” But each of those sources is incomplete or distorted. Market research reports cost thousands of dollars and are updated every few years. Vendor-supplied numbers may blend retail with restaurants, international with domestic, or single-unit pilots with full rollouts. Competitor datasets scratch only one surface—either scraping websites or calling restaurants—but can’t keep up with the size, scale, and turbulence of the industry.
At Restaurantology we approached the problem differently.
Drawing lines in the sand
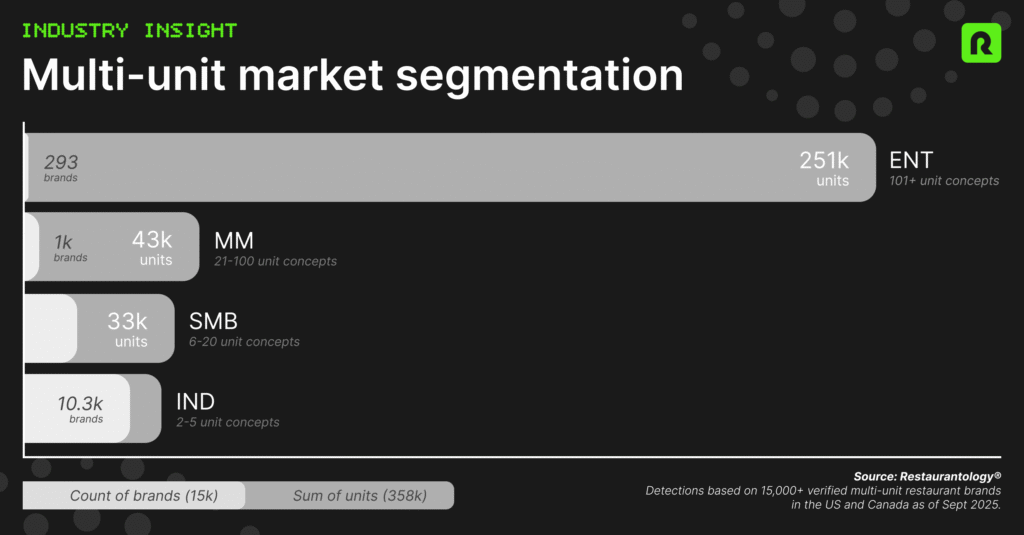
The first step was deciding where to measure. Instead of trying to catalog every single-unit operation, we focus on multi-unit brands. Density matters: one pitch equals multiple installs. In practice, that segment delivers the highest-signal data for product strategy, integrations, and go-to-market planning.
Layered detection
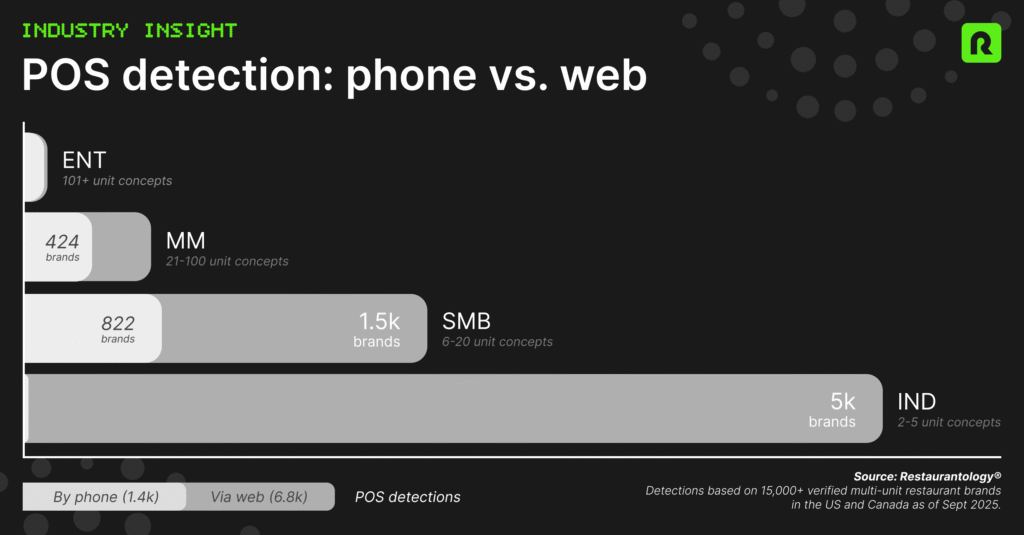
Once the segment is set, we capture POS information in two layers:
- Step 1: Web detection. We extract everything public-facing we can find. Today that covers 6.8k multi-unit brands (~50k units) across all segments.
- Step 2: Phone “cleanup.” Where a POS can’t be confirmed online, we run targeted phone verification on 6+ unit brands. This adds another 1.4k brands (~64k units) and is growing month over month.
This approach produces a living map of the POS landscape. As of September 2025, we’re already tracking nearly 8,000+ multi-unit brands, a scale no static report or one-dimensional dataset can match.
Momentum, not stasis
We’re transparent that there’s still an unmapped portion, including large proprietary POS systems, ultra-fragmented small vendors, and brands that don’t yet meet our prevalence thresholds. But that’s not a weakness; it’s exactly why this layered approach matters. Each month our coverage expands, while static market analyses grow more outdated.
Data as an advantage
The companies winning in restaurant tech aren’t guessing. They’re using verified market data as their unfair advantage. Restaurantology’s layered detection gives them the clarity that helps them move first, move fast, and move with purpose.