How to better predict multi-unit restaurant location growth

Welcome to the final installment of our three-part series on measuring, calculating, and inferring multi-unit restaurant location growth. This topic—and the way Restaurantology has brought inferred data into our tools—gets me genuinely excited. Dare I say “jazzed.”
What we’re doing to help selling teams understand, target, and focus their efforts is what one of the co-founders of HotSchedules (now Fourth Hospitality) and I dreamed about many years ago when the company expanded and matured its go-to-market and sales strategies to increase revenue by 40+% year after year.
David said to me …
“Grant. There are too many restaurants out there to go after them all, and honestly, not all of them are a great fit for what we do. Ideally, we need more confidence in how we segment the data to build out territories that can consistently feed our pipeline and our sales reps. And in a perfect world, if we can double down on the subset of multi-unit concepts that are expected to grow, even better…”
Six years later, I’m proud to say, I think we’ve done it. And we’re just getting started. So, if you’re just jumping in, parts one and two of our series explored:
- Part I: Whether multi-unit growth is the best measurement of success, and
- Part II: How to interpret multi-unit contraction in the restaurant industry
In our third and final blog post, we’re bringing it all together: taking a closer look at how restaurant location expansion and contraction data can be used to generate an Inferred Status, how that inferred data can help you better predict multi-unit restaurant location growth or contraction, and why that’s important when building out a more confident path to revenue.
But first, what is Inferred Data?
It’s no secret that data-driven sales and marketing are the norms. As technology advances, so too does our access to our prospects’ information—which can and should be used to inform and enhance our go-to-market strategies.
One type of prospect data that has become increasingly popular is inferred data, which allows companies to supplement traditional datasets with additional contextual insights about their prospects—without ever having to ask them directly.
By that definition alone, it’d be easy to confuse inferred data with another popular data type: intent data.
According to Gartner, intent data, in simple terms, indicates a prospect’s level of interest in a particular product or service online. It includes a prospect’s web searches, the pages they visit, and the content they consume.
Inferred data, on the other hand, is any piece of information that has been collected from other sources, such as customer demographic, geographic, firmographic, or technographic information. The outside source is typically a third-party market research firm or a company like Restaurantology, which sources and validates data from public records regularly.
Intent data helps you measure and assess actual observable action. Inferred data is most often used in combination with your own internal sales data to build out accounts faster, size and segment based on the reality of the restaurant industry, and gain unique insights into industry trends, such as expected growth or hypothesized contraction.
Now that we’ve got those definitions out of the way—let’s dig into how Restaurantology uses and delivers inferred data and establishes an Inferred Status.

How does Restaurantology use Inferred Data?
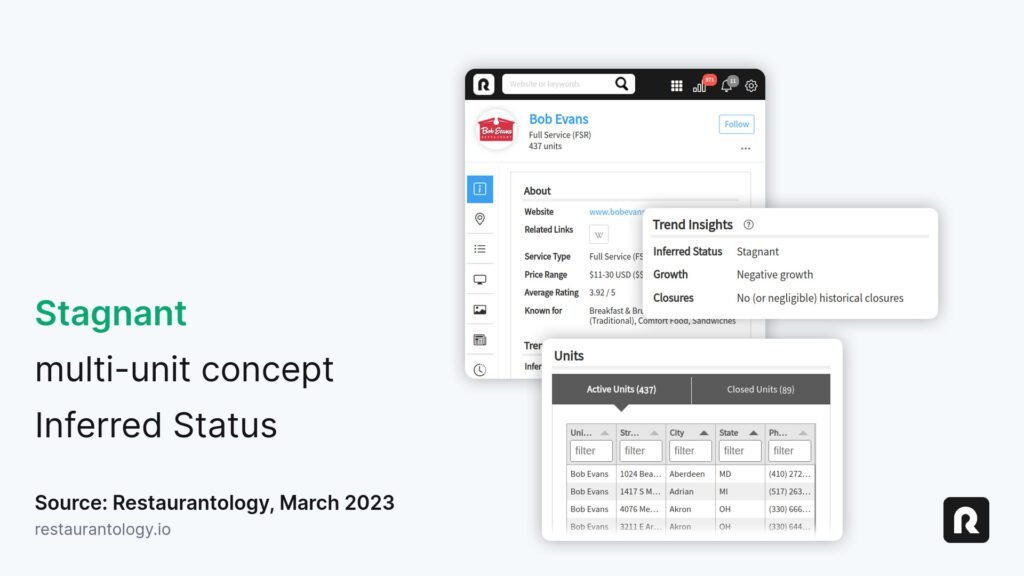
At Restaurantology, we use inferred data as a way to communicate restaurant growth and decline trends. In our Chrome and CRM Integration, there is a search filter titled “Inferred Status.” Using recent Unit Growth and Historical Closures as a guide, Restaurantology summarizes the resulting combinations into one of six possible groupings: High Growth, Emerging, Stable, Stagnant, Declining, and Struggling.
Digging a bit deeper, there are 16 resulting “Inferred Status” combinations summarized into one of six possible logical groupings. We explain more about this for current users and customers in Restaurantology’s Knowledgebase here.

A word of caution
The restaurant industry is a transient, impermanent industry. Things change—a lot. That kind of change can be a hard pill to swallow if you’ve only sold to more static and status-quo industries.
Restaurantology’s data collection process takes that change into consideration. We believe you have to stay a step ahead. Our Inferred Status is a moment-in-time assessment based on a few things:
- Publicly available, often self-reported, growth data provided by restaurants
- Restaurantology’s ongoing detection of restaurant location closures
- The delta between #1 and #2 at any given moment-in-time
This is a super important calculation we provide to help revenue teams accelerate their go-to-market strategy by segmenting the industry both quickly and meaningfully. However, because the data is regularly refreshed, it’s important that users [1] understand the underlying formulas and [2] use changes and updates to the data to inform, update, or pivot overarching initiatives or tactical account plans, for example. After all, with great power comes great responsibility …


How to use Inferred Status as a filter
Inferred Status is available in the Restaurantology Chrome Extension and CRM Integration solutions. You can view relevant fields on Concept profiles and custom object records and can incorporate them into filters for advanced searches and restaurant industry reverse look-ups.

Why are restaurant growth and decline trends important?
Understanding the Inferred Status of a restaurant concept—one that reflects where it is in its life cycle—can be important for several reasons:
For Reps:
- Reps want to identify new, high-dollar opportunities. When sales reps start exploring their territories and building a strategic plan to meet pipeline and quota goals each quarter, they typically look for high-value opportunities. AKA restaurants with a higher number of locations within their segment. Projected growth or contraction through the “Inferred Status” filter gives your teams the best forecast of expansion or contraction.
- Reps want to uncover high-dollar opportunities similar to their best customers. While Google is great, it won’t spit out a list of other “look-alike” brands in terms of projected growth within a particular segment or geographical territory. Restaurantology can and does do this in seconds with a simple search.
- Territory routing can get territorial. The restaurant industry is attractive because of the size and scale of its Total Addressable Market (TAM)—i.e., location count. But accurately sizing and segmenting restaurants by location count is a more complicated exercise than many companies realize. Having the most up-to-date unit count gives sales operations teams more confidence that the right sales or account rep is assigned a company, concept, or location.
For companies:
- Restaurant growth & contraction impact segmentation & territory assignments. Companies selling into the restaurant industry almost always align their sales and marketing teams to industry segments. After years of helping companies through this exercise, I’ve made many mistakes alongside some very smart people. We learned that a certain segment of the market might not be able to feed your sales reps with enough pipeline to meet quotas and make their number. Monitoring growth and contraction trends offer an additional perspective into your sales reps’ territories to determine if there is enough prospective growth to fuel future pipeline predictions.
- Account coverage is key. You simply cannot set appointments or win conversations, and future potential pipeline, on Accounts you didn’t know existed in the first place. For the subset of restaurant brands that are growing, boards/execs/advisors will want to know that [1] you’ve identified all of the “who’s who” of growing concepts and [2] are actively assigning and prospecting against 100% of the brands that are a good fit.
- Winning a high-growth brand early is often profitable. Depending on your comp plans, there could be a big difference between winning a 15-unit deal (and paying the subsequent commission) and selling a 3-unit deal that opens 12 more units in 12 months. Organic growth when you’re winning top brands is both predictable and lucrative. Capturing wildfire brands early is always a great strategy.
- Struggling brands need help, too. Growth, defined as location expansion, is an obvious and attractive target for sales reps. But a struggling brand also triggers restaurants to take action and make changes. A restaurant in decline may need help.
To wrap on Inferred Status
If you’ve made it this far, congratulations. Seriously. To me, selling into the restaurant industry is a bit like herding cats. Fun, sure, but not easy. And you have to like cats, which aren’t for everyone.
Restaurantology’s Inferred Status correlates relevant and validated restaurant location expansion and contraction and turns it into a reliable predictor of unit growth that sales and marketing teams can use to learn their territories faster, monitor industry dynamics that impact forecasting, and then focus their prospecting efforts on the best opportunities with more predictability and accuracy.